Showing posts with label data. Show all posts

03 July 2011

A Big Game Run Amok

My plan was to once again (for the third consecutive year) participate in the Le Tour Challenge, a crazy online virtual challenge where those of us with Tour de France fantasies can compare stats and compete for prizes and points on a leaderboard. It's far from scientific, but it has been a kickass challenge to force myself to ride for virtually every day in the glorious month of July, then collapse on the couch with a giant bowl of Kashi Go Lean (best cereal ever invented) and blueberries (best fruit ever invented) and watch the day's stage of the real Tour.

The plan started to go south last Tuesday when some of us fools got caught out in a torrential storm during the Tuesday Night Races. I've never cycled through such a heavy downpour and the lightning was a bit too exciting for my tastes. I also knew that my hard-working Garmin Edge 205 would be suffering as well. I've logged over 10,000 miles with my Garmin since ordering it in the spring of 2009, and starting last year it started to crash after riding in the prolonged rain.

The day after the deluge it was functioning fine, but the day after, I started it up and then it would automatically stop. I kept having to press the start button to get it going again. I put it in a plastic bag with some rice to dry it out (advice from tech support at Garmin), but things only got gradually worse as the week went on.
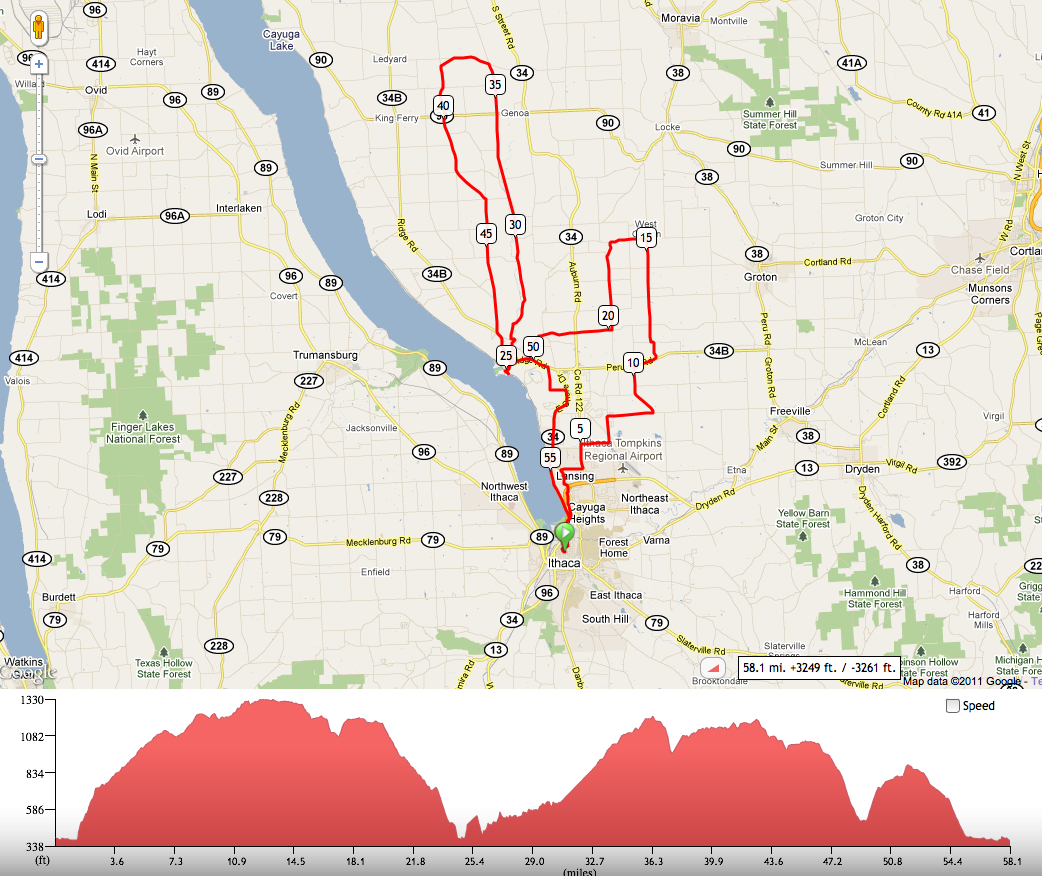
Le Tour Challenge 2011, Stage 1
To fully participate in the Le Tour Challenge and have your rides ranked, you have to submit data from a GPS device like a Garmin or a smartphone. So yesterday I rode a pleasant 58 miles, mostly with Dave, around Genoa, Lansing and Salmon Creek, and the Garmin started crashing on my repeatedly. I remembered how to reset it, but every time I reset, I lost some miles and the average speed and calorie estimates got totally messed up. I submitted my data and emailed tech support at MapMyRide, asking them to ignore my average speed data, which evidently they do anyway. The worst part about this was getting distracted from an otherwise nice ride.

I was hoping that another night in the rice bag would get my trusty Garmin back to working order, but I was sadly mistaken. I headed out for a moderate ride, meandering up through Cayuga Heights, then through Cornell campus and off to the familiar Ringwood, Midline and Ellis Hollow/Ellis Hollow Creek route. I really felt like a fool as I stopped or slowed down at least 14 times to reset the damn computer. I realized fully for the first time that my frustrations in my quest for data was completely ruining my cycling experience. I was far from being in the moment as I kept my eye on the odometer to see if it would once again lock up. 

Why was I doing this? What really was the point of participating in this virtual challenge anyway? And why do I feel the need to log every single cycling mile and compare the stats with the previous year or week or whatever? Well, if you know me at all, you know that I tend to be obsessive and I take my addiction very seriously. It seems that the older I get, the better I get at following obsessions to their logical conclusions. I'm not interested in changing this undeniably annoying personality quirk, since I honestly believe that it's O.K. or even fantastic to embrace your obsessions as long as you pick the right ones. However, I feel like this one particular activity is actually not worth the stress and frustration. Why do I really care how far up the leaderboard I go? In the first year I won a heartrate cycling meter, so there is the allure of winning stuff and the recognition that I could do pretty well when competing with thousands of others around the world. However, I don't think it's worth getting worked up over anymore. I remember last July I was pushing so hard through the month that I was actually greatly relieved when the event was over. I was really strong by the time August rolled around, but I think I can ride just as much and have more fun if I lay off a little and just ride for fun. Maybe my Garmin issues are a happy accident that led me to a helpful realization. 

I'm still leaving the Garmin in a rice bag overnight, however...

30 June 2011

Last Day of the Month Desperation Push

For the third month in a row I started to mildly panic because my total mileage numbers were down in a month-to-month comparison with the previous year. I know it's just a game and that mileage totals is not a complete measure of success in training. However I'm not one to shy away from such mental games.

I knew that I had to ride 30 miles to match last June's total, so I explored a familiar route with some new variations, namely Lounsberry Rd., Burns Rd. and Creamery Rd. in Brooktondale. It's a very pretty stretch with broad vistas of Ellis Hollow and Buffalo Hill. What a gorgeous day, though the winds offered quite a challenge on a low-energy day.

I managed to eke out just over 37 miles, surpassing last year's June total, though I doubt I'll be able to match last July's total of around 900 miles.

Some stats for the year:
Total mileage through the end of June: 2520 miles
Average miles per week since January: 100 miles
Average miles per week since May: 166 miles


19 September 2010

8,000 Miles


It's official: I've logged 8,000 miles on my road bike since I bought it in April, '09. My bike has cost me 31 cents per mile, including accessories, upgrades, tires, tubes and repairs. Also, it comes to $48 for each pound I lost in the last 1 1/2 years. Pretty good economics, eh?

13 September 2010

Comparing Data With Garmin Training Center

Yesterday was the 2010 AIDS Ride for Life century, and it was probably the best day I ever spent in the saddle. I'm savoring my memories and am waiting a few days for more photos before I post a complete report. In the meantime, I'm posting one photo of me at the finish at Cass Park with no explanations, other than to say that I'm not the guy in front. That's Hank and...wait, I told you I'm not sharing my report right now, so instead, I'll just string you along with some data analysis.

Not too long ago, Garmin came out with version 3 of its Garmin Training Center software, which I use to import data from my Garmin Edge, retrieve data, and export to the TCX format for subsequent import into RideWithGPS. Anyway, without getting too technical, I've been really appreciating a new feature of the Garmin Training Center software. Since I habitually take the same training routes frequently, now the software allows me to compare data from one ride to another to see where my speed increased or decreased along the route. This is very helpful when you're trying to improve your performance, since you can really pinpoint parts of the ride where you want to improve.

Here's what a comparison looks like. This is my latest workout/commute up Remington, Sunset, Oakcrest and Triphammer, then down Asbury to East Shore Drive. Notice that the elevation profile is virtually identical (discrepancies are caused by GPS margin of error), while the speeds in different sectors are clearly different. The blue line represents today's ride, while the red line represents my ride on September 8th. First of all, today I was .3 mph faster than on 9/8. I'm guessing that after a fantastic century followed by a relaxing rest day, I'm riding stronger. Also, you'll notice that my speeds on the East Shore Drive flats today were somewhat slower than on 9/8, and this is partly due to a generous tailwind last week that wasn't there today.

So there you have it—data analysis got even more fun. If I had a Garmin with heartrate, that would be even cooler. I still can't justify the the price, however.

04 September 2010

Rolling With It

Today's route, created thanks to G-Maps Pedometer and the
Gmaps to GPX hack tool.


You know what they say about things happening in threes. Yesterday I had to replace my shifter, a pricey repair, and then today my trusty Garmin Edge 205 suffered from some strange form of digital arrhythmia. Finally, when I arrived at Myers Rd., where I have clocked 50 mph twice this season, I was most annoyed to discover that the perfectly smooth surface had been covered with a generous covering of gravel, making it impassible until the chip seal process is completed. Not that these are real issues or anything, it's just that I  love rituals and routines, so contending with surprises kind of messes with my cycling game plan. Nonetheless, I had a really strong ride today on my familiar King Ferry/Ledyard/Genoa/Lansing loop with delightful cooler temperatures and gusty winds and rain, foreshadowing the changing seasons. Too bad I didn't get the exact ride data, but I had enough info to suggest that it was a personal best on this route. Lately I've been racking up the miles in hopes of hitting the 4,000 mile mark during the AIDS Ride for Life next weekend, and it's looking like it will come to pass. 

The Garmin Edge 205. Could it really be discontinued?
The Garmin problem was odd and completely unexpected. I've been using the Edge 205 on every ride since getting my road bike with no technical problems, and then this morning I couldn't get it to power up. Fortunately I found the instructions online on resetting it, and it was working perfectly fine until King Ferry, when the speedo stopped responding and was stuck at a set speed. None of the buttons worked, and after repeatedly attempting to reboot, I finally got it working again. The device worked perfectly fine from Ledyard to Ithaca, but when I tried to stop it, once again no button responded and all data was lost after a forced reboot. It seems to be working fine right now, but it will take a few uneventful uses before I trust this pricey but very valued device. I'm so data-obsessed that I can't imagine riding without a GPS unit!

I'm wincing as I read through this post. Whatever happened to just riding without fancy gear or accessories? I remember when I stopped using a cyclocomputer on my touring bike and how liberating it was, but now it's very hard to imagine riding without the GPS data, which keeps me focused on improving performance on every ride, not to mention the cool mapping and metrics analysis aspects. I guess I'm just a data obsessed and fairly entrenched, but I guess that there are worse addictions.

01 September 2010

2010 Stats At Six Months

Back to the blog after a break, though I haven't taken a break from cycling. Now that August is past us, here is a month-by-month column chart of distance and vertical ascent data for the first six months of the year:


Due to our family vacation in August, I had a number of days off of the bike, so I tried hard to make up the miles and vertical feet. I'm pretty pleased with how August turned out, and now that I'm returning to work, the September stats will most likely look like April. I believe I'm still on target for my 4500 mile goal for the year.

Overall, I'm at 3787 miles and 221,686 vertical feet of climbing for the year.

08 July 2010

In the Throes of the Le Tour Challenge

I don't really know why I'm so obsessed with the Le Tour Challenge, but it probably has something to do with my love of analyzing cycling data and my desire to move up the leaderboard. For the uninitiated, participants ride during as many stage days of the Tour de France, then upload their ride data from their GPS devices. Your data only counts if it comes from a GPS device, which is only fair, and then your data is compared with data from all other participants, as well as the Tour cyclists.

Looking good so far—my Monday Cayuga Lake loop had me in 4th place overall for the stage and 9th overall, but now that my distances are more modest, I'm moving down in the standings a bit. Battling the high heat and humidity has been a bit of a challenge, but for some reason, the last two days have been really strong, and I've been able to stay hydrated throughout.  Yesterday was a typical Lansing loop, while today I took on Ringwood Rd. and Snyder Hill Rd. Surprisingly, both of those hill climbs were perfectly manageable, thanks largely to the shade from the forested land on the bulk of the steepest portions. I hope to ride almost every stage this year and take rest days during the Tour rest days, but we'll see.

Wednesday, Stage 4 Data


Thursday, Stage 5 Data

30 June 2010

Mid-Season Assessment

Yesterday we were blessed with perfect cycling conditions, with temperature in the upper 60s, low humidity, a nice breeze, and endless views for miles from the top of Ringwood Rd., unobstructed by the haze so prevalent during the summer months. I enjoyed a fun training ride with my friend Bruce, who is new to road biking. He's a remarkably quick study, and soon he'll be burning up all the glorious hills in the region.

As I was advising Bruce on his setup, adjusting seat height and handlebar angle, swapping saddles,  and cleaning the drivetrain, I was reminded of how much I have yet to learn in the realm of bike mechanics. I noticed that when I move the handlebars from left to right, my wheel locks into the middle position, which can't be good. After a little bit of online research, I found out that this problem is referred to as "indexed steering." The headset bearings tend to remain in one position (straight in line with the frame) much more than any other, and the bearings wear depressions in the bearing races. While I'm stressing a little about causing more damage or losing the ability to easily turn, I also welcome the opportunity to learn about headset bearing maintenance and replacement.

Now that I'm four months into the nine month cycling season, it's time for a mid-season assessment. My goal is to at least ride 4500 miles this season, but of late, vertical ascent stats have become even more important to me than mileage.

Overall Stats, March 6-June 29, 2010:
Mileage: 2180 miles
Vertical Ascent: 124,827 ft.
Calories Burned: 146,700 kcal

Here's where I've cycled so far this season:

Mileage per Month:

Vertical Ascent per Month:

I'm fairly pleased with these stats, and look forward to some longer summer rides. Tomorrow it'll either be Cayuga Lake or Keuka Lake, though Cayuga is the more likely choice. This is to fulfill my random goal of biking at least five of the finger lakes this season. Owasco is already crossed off the list, so now comes Cayuga, Keuka, Seneca and...to be determined.

Yesterday's ride with Bruce:

31 May 2010

Topping Off A Great Month

Without a doubt, this May has been my most memorable month of cycling, with my first two bike races under my belt, 700+ miles accrued and over 42,000 vertical ft. climbed. What a whirlwind of activity and apprenticeship, as I have learned so much from the likes of Cookies Ernie Bayles and Bill Erickson, to name only a few. I've also learned quite a bit about mystery noises and have received great assistance from Keith Thompson, Glenn Swan, and the good folks at Cayuga Ski & Cyclery.

Today I topped off this memorable month with a ride up Ringwood via Lansing, an old favorite. The weather was once again perfect, and I had a time deadline that was excellent pressure to ramp up my average speed on the return trip. Above are the metrics for today's ride—this is a terrific feature provided by RidewithGPS that allows you to study how much time you ride at specific speeds, and how fast on average you ride at specific grades. I guess I have to gather up this data from the same loop over a period of time to see how my performance improves.

I believe that the explosion of web tools to help you analyze your rides can really make a difference in improving your training and adds to your cycling enjoyment. Without these tools, cycloblogging would be far less interesting.

Here is my log for the month of May. My goal is to exceed 2,000 miles before the end of June, but I'll likely be around 2,200 miles before July 1.

25 November 2009

Music To Spin To

Morning Edition no more! There is so much written about what to engage your ears and eyes while spinning on the trainer, and this no shortage of product to fill this supposed need. Spinervals gets lots of hype, and while I suppose it would be kind of cool to fantasize about competing in a race and watch the road while analyzing your PowerTap data, I disagree with the assertion that Spinerval DVDs are "a must for indoor training." All I care about is developing tasty music mixes to make the minutes fly by.


No techno for me, thank you. NPR's Morning Edition was a real drag to work out to, so this is my first attempt at a workout mix. Real standouts on this mix are Bowie, Gang of Four, Labh Janjua & Panjabi MC, and Old 97's. It's not all about tempo, but it seems to be important to alternate driving up-tempo tunes like Doreen with slower, quieter songs like Clem Snide's The Sound of German Hip-Hop. All in all, this is a pretty good workout mix, though I need to really experiment and change things up. Today was the first time that I trained for more than 35 minutes...I made it to almost 1 hour and 1,000 calories, and the music really made a difference.

I don't want to entirely abandon the notion of watching video while working out, and I even shot video of my favorite climbs, thinking that I'd make videos to watch while working out, but it seems to me that the audio element is far more important than the visual.

Suggestions for workout distractions are welcome!

15 November 2009

Big Dairies & King Ferry

As the king of hyperbole, I won't shy away from describing this ride as absolutely euphoric. It's November 15th here in Ithaca, and the high temperature on my ride was 67 degrees! Riding without a jacket in mid-November is most bizarre, but I'm most grateful to the cycling goddess for arranging such ideal conditions and facilitating the further extension of an already long season.


Today I passed the 2800 mile mark for the season—I carefully chose a route that would get me there, and since I haven't been up along the lake to the King Ferry area in a while, I chose that route. This was my first time on Ledyard Rd., and it is the perfect choice for heading east and turning back to Ithaca.


I'm so glad that I decided to bring the camera today. Usually I am reluctant to bring the camera along, since I am trying to get maximum miles in during my allotted cycling time, but today I had the luxury of some extra time.

As you can see, I saw some very noisy wild turkeys on Remington Rd., just a couple hundred feet from Boynton Middle School. The sun was only with me for the first half hour, then the skies darkened and I thought perhaps I'd encounter rain, but it just stayed overcast for the rest of the trip. With all of the trees bare, it was a great day to get shots of the lake in the distance, as well as old barns and some beautiful homes.

This route takes you through some very big dairy operations around King Ferry, Genoa, Venice and East Lansing, and I tried to imagine what the old farming days were like in this area. There are a few remnants from those days, but now, the only shiny and new-looking farms are huge, sprawling dairies. It's so sad that family farming is the exception, not the rule.

Drivers seemed to be less attentive toward cyclists now that it's mid-November, and on a couple of occasions, drivers almost turned into me while I was in an intersection. Good practice for the lungs (I don't shy away from shouting at drivers) and for the evil-eye-darting-glance, but moments like those are most unwelcome. Us cyclists aren't asking for much, just a little attention. Put those damn cell phones away, people, and watch the road!

You can also see that I was all about the data today. Regular odometer, heartrate cyclocomputer and GPS, not to mention the camera. I know that it seems like overkill, but I won't be using the heartrate unit as an odometer. I've read that it can easily get reset by accident, and I want a reliable odometer to keep track of my road miles. Furthermore, my basic meter has a thermometer, which is pretty handy. Still, I can't wait to get a new Garmin Edge with cadence, like a Garmin Edge 405 or 605. That way I can ditch the Polar unit and have my heartrate data integrated into my speed and elevation data. This will allow me to see how my heartrate changes during specific climbs. This would be very valuable information for training purposes. Too bad I'd have to shell out around $400...I'd much rather spend it on a new wheelset or something.

Speaking of heartrate information, I hit a max of 170 at the top of Ridge Rd. in Lansing. That was pretty cool. I averaged 144 BPM for 2 1/2 hours, which feels pretty damn good. I don't think that downhill skiing will come anywhere close. Sure, cross-country skiing would be similar, but I probably won't have many opportunities this winter. Who knows...snowshoeing might be a good middle ground.

My favorite part of today's ride was Gulf Rd. in Lansing. There's a short, steep climb where Gulf meets Conlon Rd., and it's a real pedal stomping heart pounding affair. That turn onto Conlon Rd. is so gratifying.

See the ride on Everytrail

Here's the data:
Distance: 46.13 miles
Elapsed time: 2 hours, 30 min.
Avg. speed: 18.5 mph
Max. speed: 46 mph (heading east on Ledyard toward 34)
Vertical ascent: 2566 ft.
Calories burned: 2431
Avg. BPM: 144

31 October 2009

Halloween Ride

Who'd have thought such opportunities would present themselves? No jacket on Halloween with dry roads and dramatic skies. Wind speeds were around 15 mph up in Lansing. Intense tailwind on the climb all the way to Searles Rd. had me sailing up Triphammer and than POW! What a brutal headwind for the return trip.

As a data-obsessed cyclist just starting my heart rate monitoring adventure, I was quite amazed at how much a headwind adds to the heartrate, even when I was struggling to go faster than 14 mph on a relatively flat road. Having this data is most helpful, and lessens the frustration of pedaling hard and not going very far. At least I have concrete proof that I'm working hard.

Data for today's ride: 19.6 miles, 147 avg. BPM, 19.2 mph. Odometer for the year: 2670 mi.

Reality is sinking in that this is probably the last week of road riding for the year, but at this point I feel very fortunate that the season has lasted so long. Some lingering questions: When will next season begin? What kind of pedals will I buy? Ultegra/105s or Look Keo? I have all winter to figure that one out.

The picture is from the Library of Congress' American Memory Project:
Bike racer, Carl Stockholm Stockholm sitting on a bicycle in front of a light-colored backdrop in a room. 1929. Photograph. Chicago History Museum, Chicago. Http://memory.loc.gov. Library of Congress. Web. 31 Oct. 2009.

23 October 2009

Data driven cycling with GPS and Google Earth


In the spring of '09 when I finally bought my new road bike, I also budgeted for some cool accessories. The coolest one by far was a Garmin Edge 205. This handy little unit has fundamentally changed the way I ride and where I ride. It has also become the catalyst for reflecting on my rides with friends and total strangers via online social networking tools (Facebook and Twitter) and online route sharing sites such as Everytrail.com and Mapmyride.com. I also import all of my rides into Google Earth, which lets me do a virtual flyover or tour of my ride.

The Garmin Edge 205 is the entry level bike GPS unit. While its capabilities are limited in comparison with to pricier models, it was more than sufficient for my needs. While the main function for car GPS units is to keep from getting lost and find the fastest way to a specific locale, I use my Garmin to monitor my speed, distance, average speed, calories burned, and most importantly, my altitude, percentage of grade on my climbs, and my cumulative vertical feet climbed.

My Garmin accompanied me on most of my rides this year, and really gave each ride a life of its own. Sometimes I would bring a small camera along as well. My typical post-ride routine is to download my GPS data, then use an online converter tool provided linked off of Everytrail.com to convert the file into KMZ format. Then I upload my ride to Everytrail, write up a description, add pictures if available (sometimes I add screen shots from Google Earth), then share the ride with my Facebook and Twitter friends. After that, I upload the KMZ file to Google Earth and view the flyover (tour). I have also started posting videos of my Google Earth tours with narration to YouTube.


Why do all of this? I actually love it, and it allows me to connect riding with other activites that I'm interested, such as blogging, mapping and video editing. I get a chance to reflect on the ride, study my data, try to beat my best average speed on a given ride, and study the maps to look at new possibilities for routes. This has all made me a better cyclist, without a doubt.

This summer I participated in the Le Tour Challenge, an event sponsored by MapMyRide and others. I rode every day that I could that coincided with a Tour de France stage, then uploaded my ride data to MapMyRide. I could see how my data compared with other participating cyclists as well as the Tour cyclists. I ended up with some pretty satisfying results, which drove me to ride even harder. I also won a really nice Polar cyclocomputer with heartrate monitor, which brings me to thoughts about what I'll do with this in the future.

While I like the Polar cyclocomputer's heartrate monitoring function, and really see the value of assessing heartrate data, it seems silly for me to ride with two separate devices (GPS and Polar). It would be hard to justify this, but an upgrade to an Edge 305 (or better) would allow me to capture heartrate data and eliminate the need for the Polar unit. Also, the heartrate data could automatically be added to the Everytrail posts.

I loved watching all of my rides accumulate in Google Earth—it provided very tangible evidence of my progress, and prompted me to explore areas less traveled. In the spring I'll hide all of my rides in Google Earth and repopulate the map all over again.